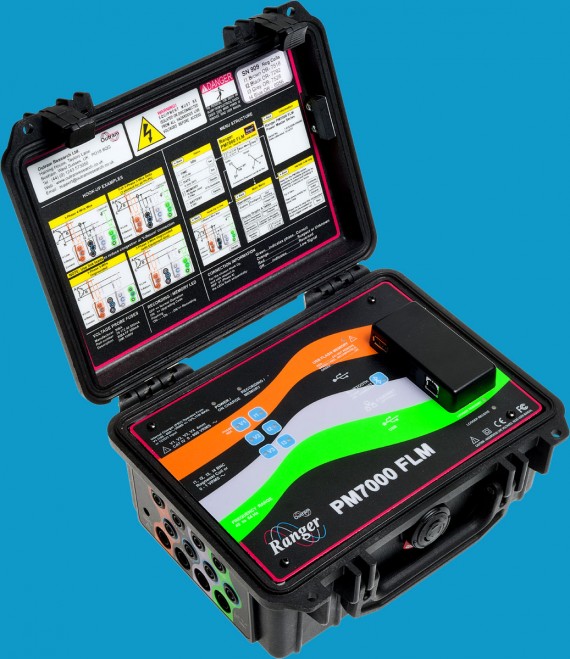
Ranger PM7000 FLM
The first ever commercially available fault level monitor.
- Cat IV 600V Fault Level Monitor
- Composite Fault Level Results
- Fault Level Trend over time
- Comprehensive Power Quality Analyser
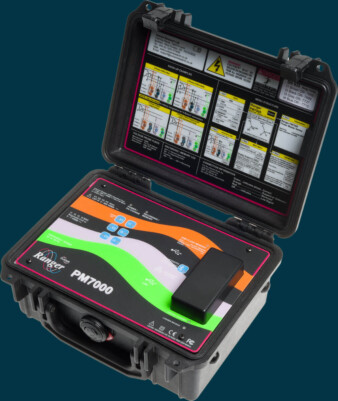
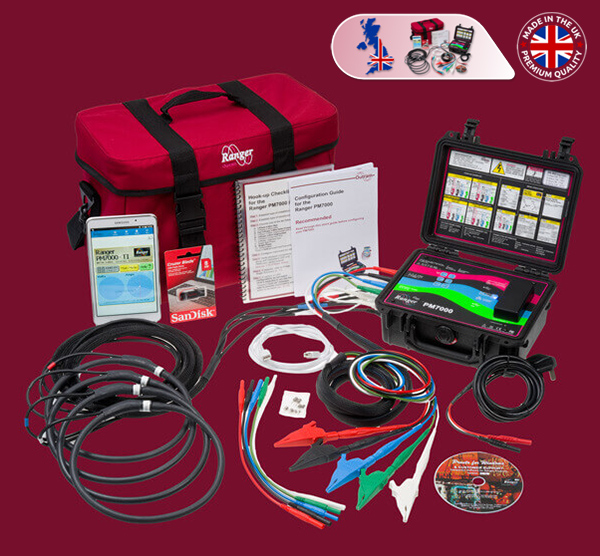
Ranger PM7000
Power quality, harmonics, flicker and waveforms monitor.
- Harmonics measurements to the 127th (IEC 61000-4-7)
- Single Cycle Adaptive Store™
- Auto-Ranking Waveform Capture
- Measurements to ENA Recommendation G5/5
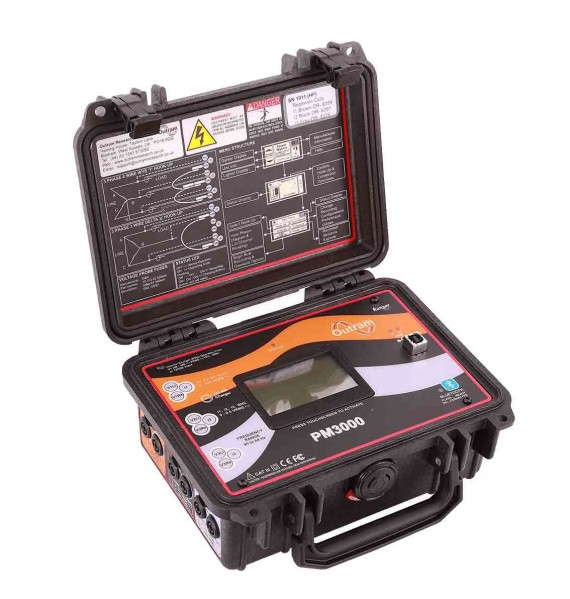
Ranger PM3000HF
Three Phase power quality, harmonics and flicker monitor
- Single Cycle Adaptive StoreTM
- Harmonics to the 15th (THD to 25th)
- Flicker measurements to IEC61000-4-15
- Touch Screen on unit and Bluetooth


Frequently Asked Questions
How do I place an order?
If you would like to order from Outram Research, please contact us today by filling out our enquiry form or calling us directly on +44 1243 573050. Whether you already know what you need or are still gathering information, our team of experts would be happy to supply you with any details you require.
You can request a quote from us or we can talk you through the range of products we have on offer to help you understand which one might suit your needs.
Why choose Outram?
Outram Research has more than 30 years of experience in data logger design and signal processing and has been specialising in the creation of power quality analysers for more than two decades. Our equipment utilises highly precise and reliable data acquisition systems that take up to one million samples per second, meaning we have a power analyser to suit most requirements.
We supply a full range of power quality analysers and fault level monitors, and our vastly experienced staff can talk you through the options available. We put a strong focus on customer service to ensure you get the perfect product.
Can I hire from you?
A selection of our products is available to hire. If you just need a power analyser for a short period of time while you carry out work this could be the right option for you. We also offer to hire as an opportunity to try before you buy – if you decide to buy the product after hiring, the cost of the hire comes off the sale price.
If you are going to be using a power quality analyser for a significant period of time you might assume buying is the only option, however, we offer discounts on long-term hire, so do get in contact with us.
Which Outram product is right for me?
Whether you are looking for a panel-mounted energy monitor, a three-phase power quality analyser or a fault level monitor, we have a full range of products to suit your requirements. If you are not sure which of the Outram products might be right for you, we recommend getting in contact with us as soon as possible.
We have an experienced team who have expertise in the products we offer – we can talk you through the options and helped you to make an informed choice.
What to do if I need support?
If you have encountered any kind of problem with your power quality monitor or do not know how an aspect of the equipment works, we recommend checking our list of Frequently Asked Questions about our products or looking through our Knowledge Base on the Pronto software. This contains the resolutions to a number of known issues as well as providing advice and tips on getting more out of your Outram product.
If these do not answer your questions or you have a specific issue that you need support with as soon as possible then please do not hesitate to contact us.