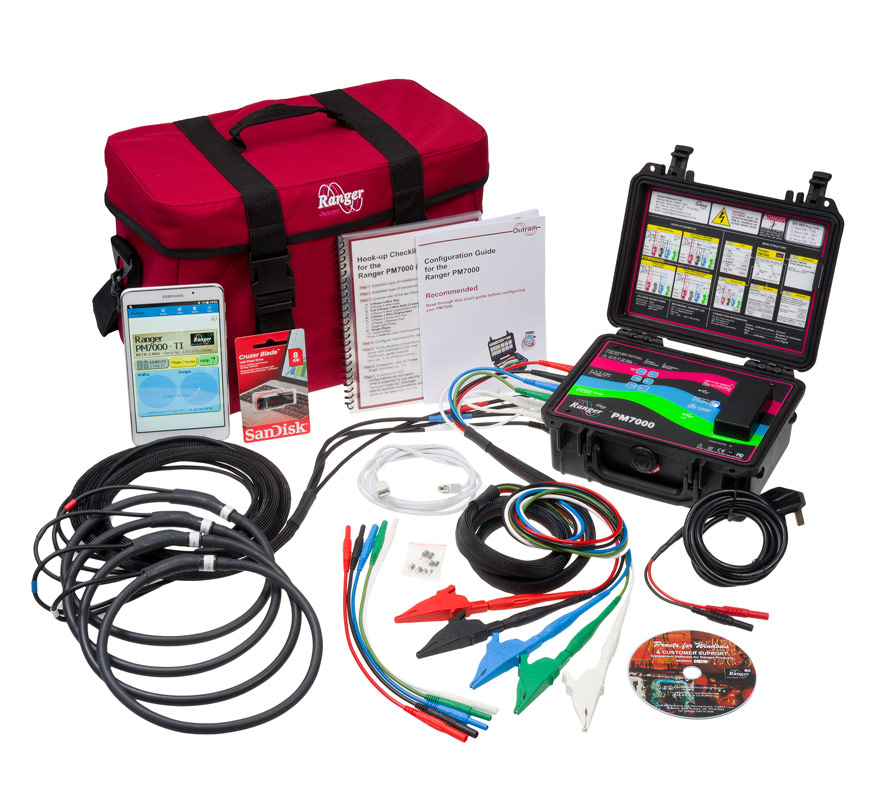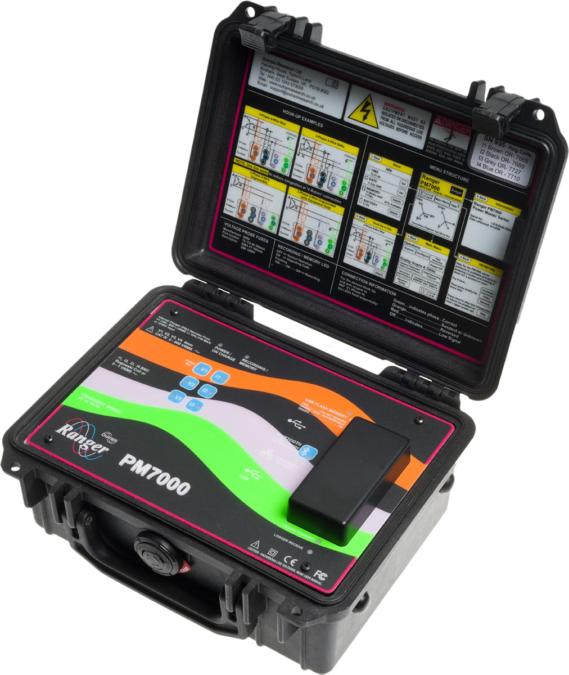
Ranger PM7000 Power Quality Analyser
Power quality, harmonics to G5/5 (to the 100th), flicker and waveforms monitor.
The Power Master 7000 is a user-friendly, comprehensive, compact and cost-effective power quality monitoring and trouble-shooting unit.
Three Different Recording Regimes
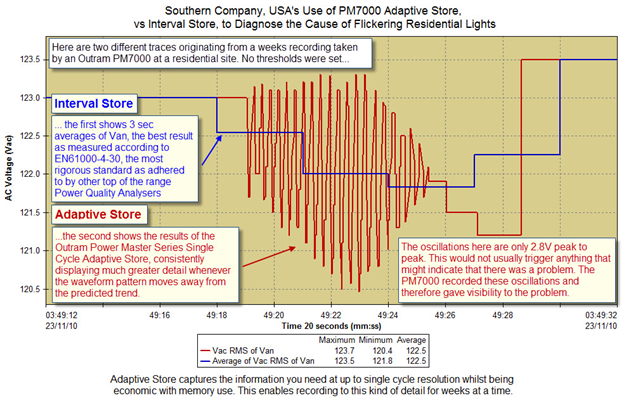
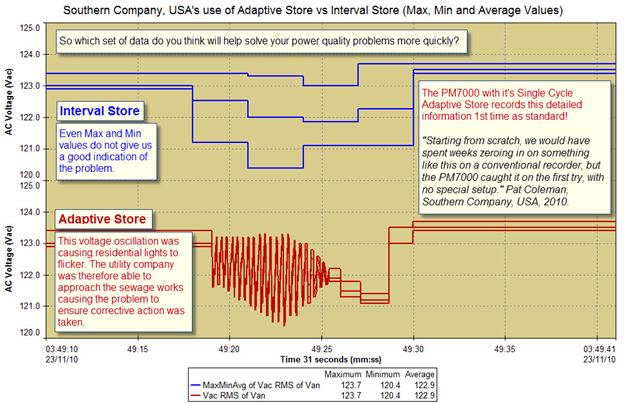
This is the information storage technique used on our 32 detailed recording channels. During the recording the PM7000 automatically alters the detail of the recording whenever a disturbance occurs i.e. whenever there is an anomaly in the recording. This means that when nothing ‘interesting’ is happening the PM7000 does not record every cycle but gives the average, max and min during that period. When something ‘interesting’ happens the analyser records in much greater detail, down to a single cycle, without the user having set thresholds. This makes analysis of the recording much easier and faster, being able to zoom into the causes of power quality problems much more quickly and easily.
Using Adaptive Store is considerably faster and simpler than setting and adjusting trigger levels as required by other power quality monitors: a process that can lead to an operator taking weeks to ‘zero in’ on the problem, as well as needing to wade through much unnecessary data.
Please read our press release for the specific application.
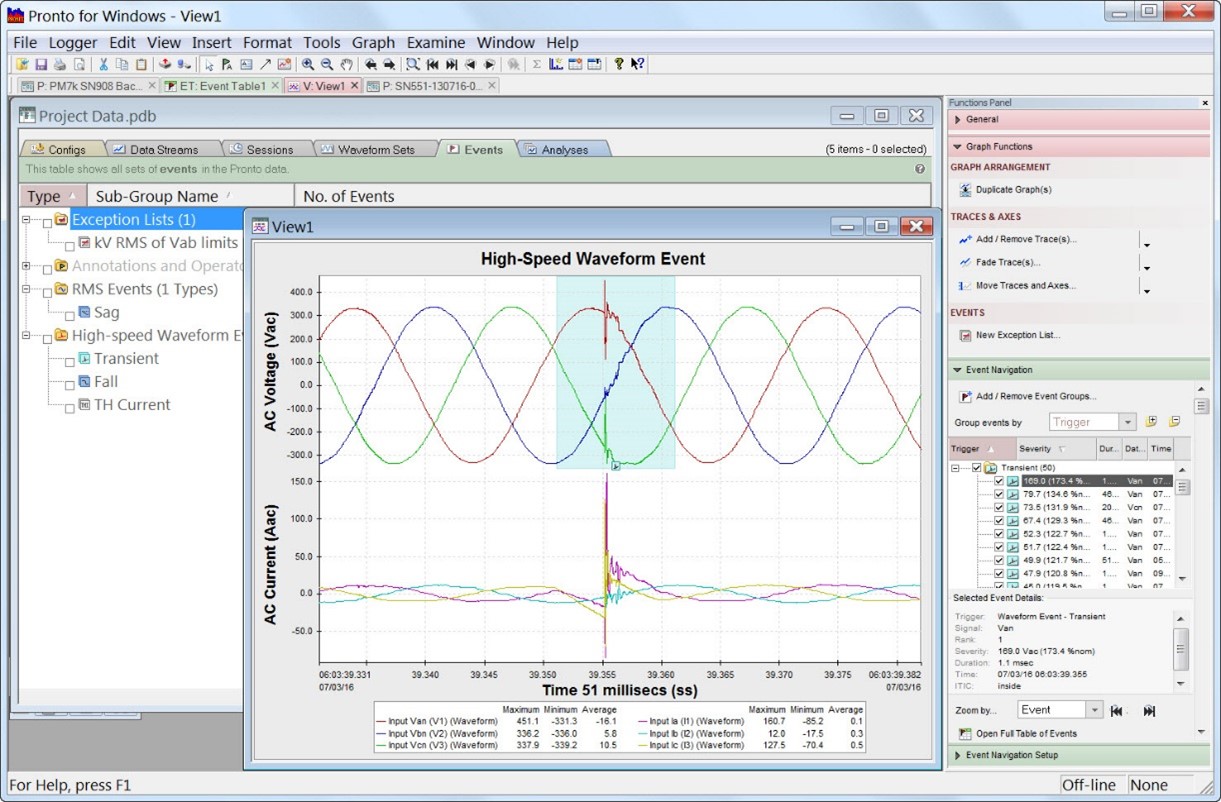
This Auto-Ranking Waveform Capture system automatically keeps the sub-cycle waveforms of the most serious events captured during a recording, discarding the least important, without the need to set any thresholds. The user can choose how many waveforms he wants of 7 different types of event on each detailed channel measured and just get the worst ones most likely to be the cause of his power quality issues. This saves a lot of time and effort analysing the data.
Application for Auto-Ranking Waveform capture – See below how a captured disturbance led to solving a problem?
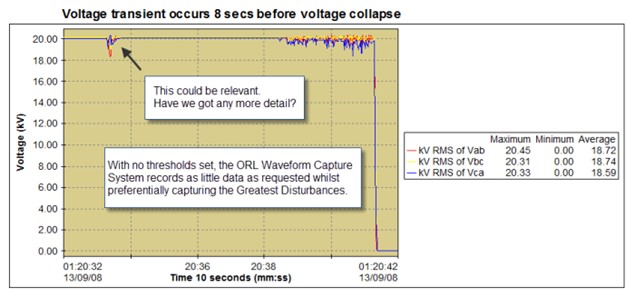
Could this short lived transient have caused the voltage collapse which came 8 seconds later?
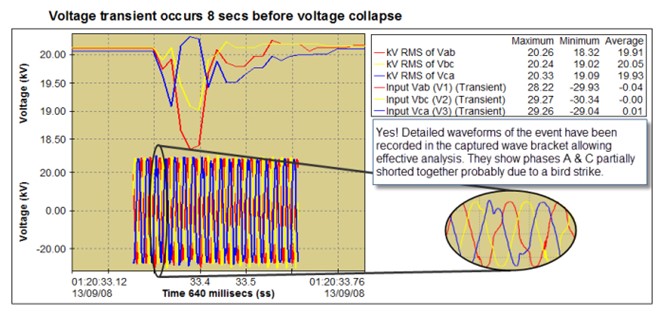
We can zoom in and see that the waveforms corresponding to the voltage transient have been captured, giving us a useful picture of what happened to the different Phases. With the PM7000 you can zoom straight to the problem without having to trawl though mountains of data.
Waveform recordings are continuously re-triggerable and do not require re-arming, so no data is missed.
Over 470 parameters are recorded at a specified interval during every measurement, automatically without any user input. This increases to 1000s with our Advanced Harmonics option, measuring all individual harmonics to the 100th on 6 inputs (and to the 50th on the other 2) as well as sub group and interharmonics (more detail below). If a user forgets to specify a particular parameter on one of the detailed channels mentioned above (Adaptive Store), there’s no need to worry as it will very likely be measured automatically in General Parameters. This reduces the need for repeat recordings, saves time and gives a large amount of trend data on a user or their customer’s site without any further thought from the user.
Software
We believe that Pronto is the most comprehensive Power Quality Monitoring Software in the industry. It is well suited to basic compliance testing of data as well as more detailed analysis work. The power and flexibility of the software soon become apparent when the user zooms in quickly to data of interest to then view and present any combinations of data in a clear and concise fashion. The user can easily export tables, copy and paste graphs, add in and remove data parameters quickly and efficiently, as well as effortlessly create templates for both tables and graphs.
Pronto has been developed by Outram Research over the last 30 yrs, originally designed for the process industry. Not only can it manage the data recorded by our PM7000 models but it organises effectively the data downloaded from the whole range of Outram Power Quality and Fault Level Monitors including our single phase PM1000Mk2 to our PM7000T (sampling at 1.228 million samples per second).
It is VERY Flexible. The user can do a lot with the data, including the automatic joining together of distinct recordings, and show data from different Power Master Analyser models on the same graph when measuring around the same time.
What makes Pronto unique is the fact that no, or very few, associations have been made regarding any streams of data recorded. Power Quality data logged by the Power Master Series (including thousands of parameters) can be presented in a very large number of different combinations, making manipulation of the data easy for the user. Data from different Power Master or Ranger models can be viewd together for easy comparison. We understand that our software is also significantly faster to draw than other products, making a large difference to the time spent analysing data.
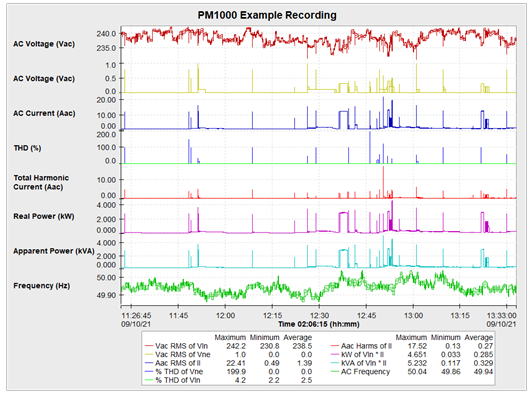
Nine different parameters presented on the same graph to enable easy comparison of each parameter with any other.
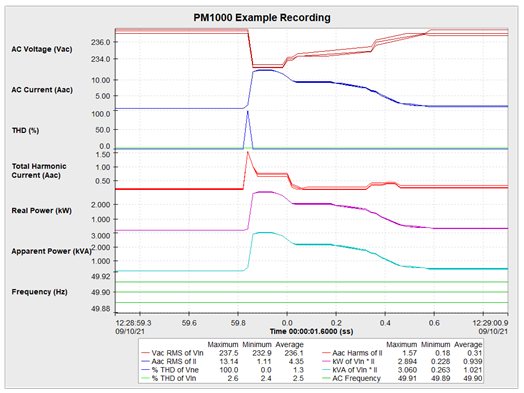
Zoomed in on the graph above, we can see the detail captured on each parameter recorded.
Zooming in more shows the detail captured on each parameter recorded down to single cycle.
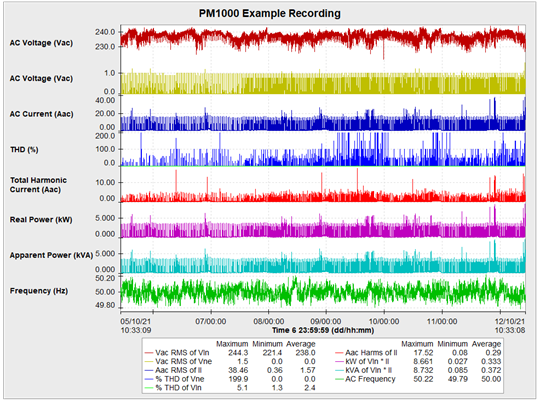
The majority of these current spikes and associated voltage dips last less than a second but it is possible to see exactly what is happening. In fact there are around 4 different fridges in use in this recording and each one can be identified by its profile captured by the PM1000 with the same measurement technique also used in the PM7000HF but over 3 phases.
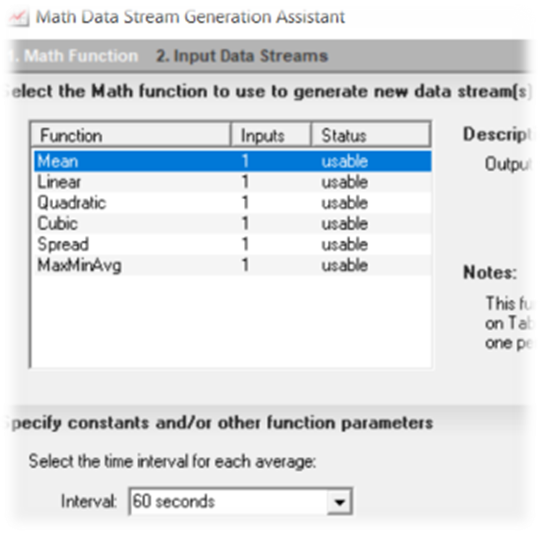
The user can also create Maths data streams using any recorded parameters. They can create averages over 30 sec, 1 min, 5 min, 10 minutes (or in fact any integer time span you choose) which can then be viewed on a graph. (They can also be tabulated). It is possible to choose from any of the maths functions seen here:
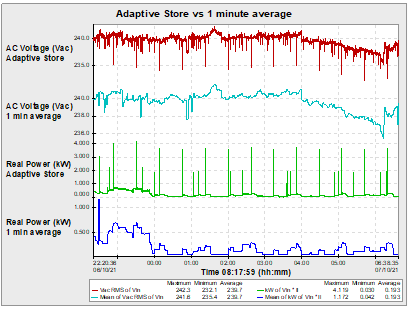
Showing the averaging function used in Pronto (1min averages vs Adaptive Store), is another reminder of how important it is to record that single cycle detail in order to carry out the most useful data analysis possible.
Data Visualisation
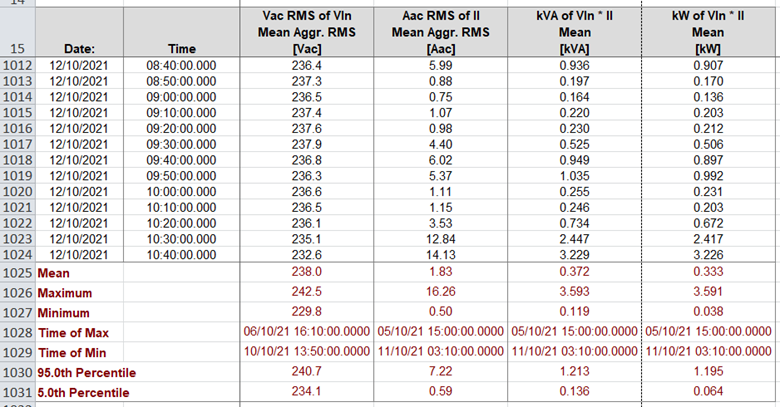
Create tables in Pronto of all the data captured (exportable into Excel and PQDif) and choose how the data is presented. Whether you choose an average over a period to report against the Standards or other options, you can also include the max and min (with times), the mean, 95th percentile, 5th percentile (percentiles are selectable) in a summary section in your table… there are a huge number of possibilities.
Below is a table of data measured using Adaptive Store, averaged over 10 min intervals (rows 16-1011 are hidden in this case), with the mean, max, min and 95th and 5th percentiles.
If you would like to be able to recreate your graph or table, save it as a template to create it again with minimal clicks from the data in your next recording, including formating and title.
Our PM7000 range can also measure 1000s of General (Interval) Paremters as well as carry out Auto Ranking Waveform Capture.
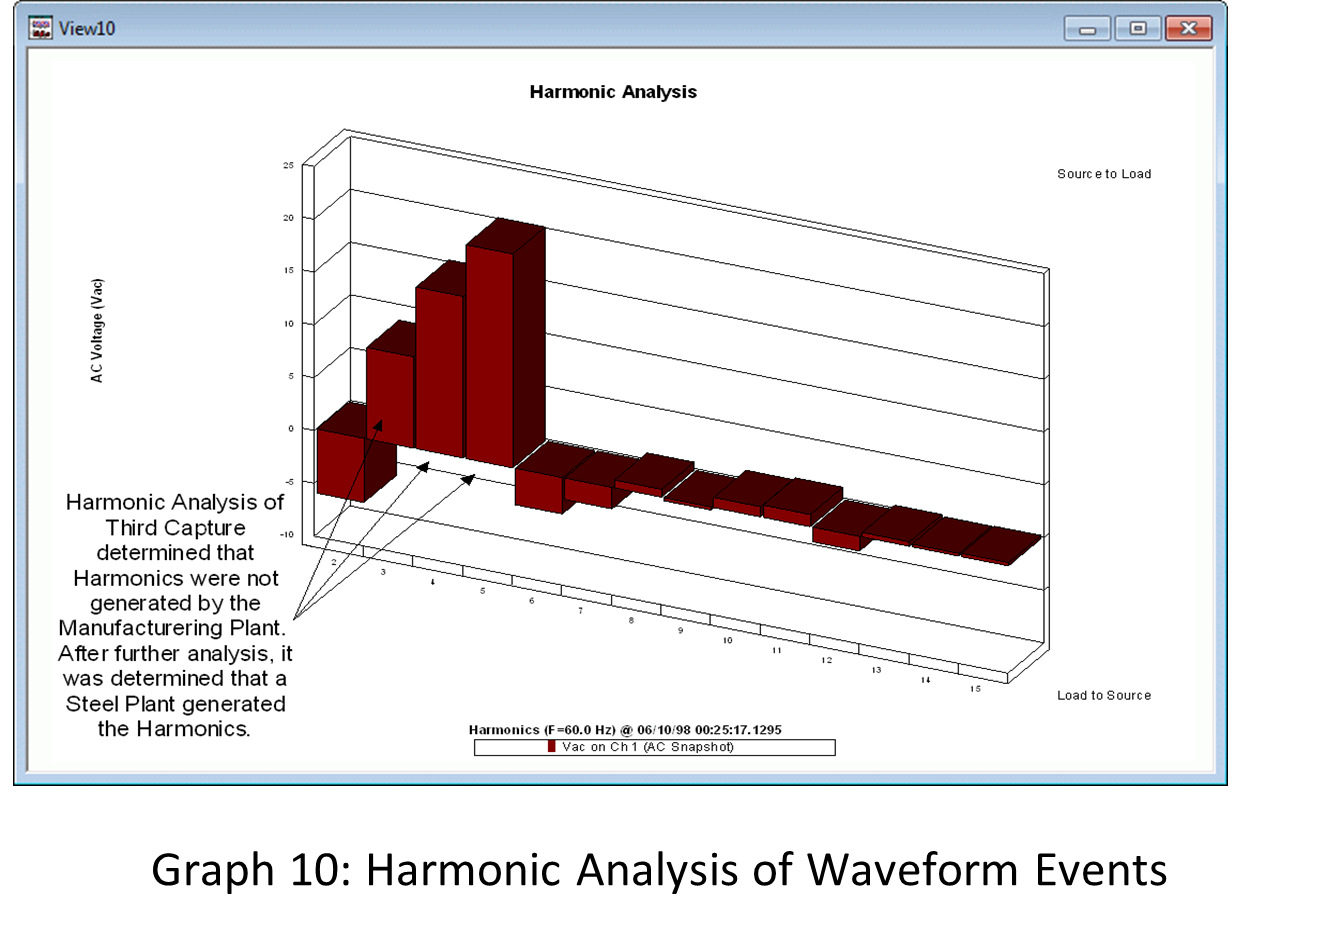
Pronto can present harmonic analysis of captured waveforms, in some cases displaying the apparent direction of those harmonic sources.
Create an extensive Harmonics Survey Report with a few clicks using our G5/4 Reporting function. We use this as the basis for reporting to the updated G5/5 harmonics requirements so it’s a great tool for whatever reporting requirements you have.
We also have tutorials to help users quickly get up to speed with enhanced features of the software. You can find more at
Graph zooming and panning without changing cursor types
Quickly zoom and pan around your graph without using the toolbar or graph menu to swap cursor types.
Templates (1 of 3) – Creating/using view (graph) templates
Save your favourite graphs (with all formatting and setup) into view templates that can be applied to new data with just a few clicks.
Templates (2 of 3) – Organising view templates
Rename, delete and move into folders. Organise your favourite view templates in an easy to use browser. Also find templates on your hard drive to copy to other computers.
Templates (3 of 3) – Editing/Duplicating templates
Edit an existing template and see how to create a new template based on an existing template but for different data streams.