The analyser did everything that we needed. We were also impressed with how quickly it got across the US.
The analyser did everything that we needed. Rob was surprised at how easily it went on.
We were also impressed with how quickly it got across the US. It was there before we even left [the UK] and we didn’t expect that to happen.
It’s a specialised subject and the support we received from Duncan was second to none.
Chris Brookes, Simpson and Wood, UK Feb 2019
By far the best project partner I have ever worked with!
Thank you for all the help and support you all gave me on the RTFLM project… It was an absolute privilege to work with you all and Outram are by far the best project partner I have ever worked with!
Cameron Scott, Innovation Engineer, UK Power Networks, 2022
It’s shown me just how much time your software is going to save me!
What you showed me this morning and what I’ve been doing this afternoon has shown me just how much time your software is going to save me!
Bob King, Power Phase Services, UK (Contracting for Network Rail)
Bluetooth functionality with PMScreen and real time monitoring is sensational.
Thank you so much for attending to [my support query], and so quickly! Very impressed with these [PM3000] power analysers and the Bluetooth functionality with PMScreen and real time monitoring is sensational.
Euan Galbally, Operations Project Engineer - Supply Restoration, SSE.
Your kit knocks spots of the bigger manufacturers
Your kit knocks spots of the bigger manufacturers.
Andrew Williams, MD, Smart Electrical Systems, Sept 2018
It’s an amazing piece of Kit!
I certainly will be hiring another PM7000 again. It’s an amazing piece of kit!
Stuart Turner, PCAS (Power Control and Automation Solutions) Ltd, Feb 2020
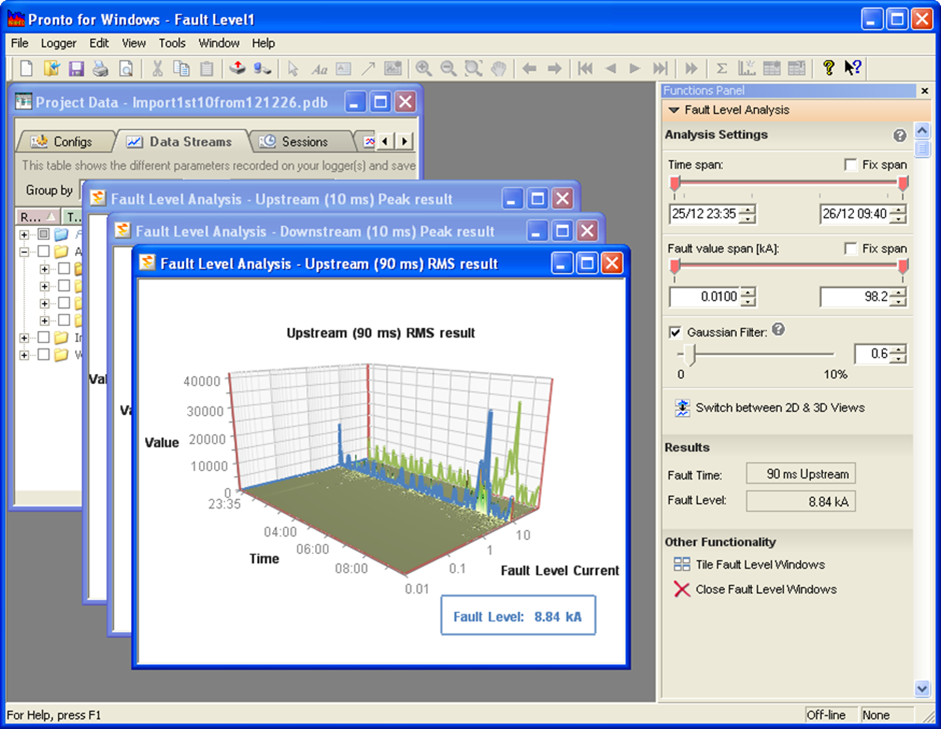
The Outram PM7000FLM … software made analysis of fault-current straightforward
We found the Outram PM7000FLM useful for capturing data, and its software made analysis of fault-current straightforward. Other methods of data capture can be used, but would require further development to accurately give fault level information; the area where the FLM scores is its ease of use, and also that statistical analysis is applied over the whole test period, rather than at a ‘snapshot’ of one event as our analysis. This makes it less prone to noise and other disturbances on the system.
Rob Weller, Rina Consulting, UK Power Networks Earth Fault Level Project, March 2018
That’s a hell of a piece of Kit!
That’s a hell of a piece of Kit!
Now I’ve seen what it can do I’m going to mention it to another customer here in the UK who I know is having trouble.”
Rob Rose, Simpson and Wood, UK Feb 2019
….Commendable for its ease of use and portability
The Outram equipment is commendable for its ease of use and portability.
Rob Weller, Rina Consulting, UK Power Networks Earth Fault Level Project
…PM3000 is the best product in my shop
The reason I think your PM3000 is the best product in my shop is the reliability and the software. I use 5 different brands of recorders and this one by far has been the most reliable. The software updates are great, with the 60 day reminders. The layout of the software and every single function make it simple and user friendly unlike most products.
Greg Ellis, Electrical District #3, Arizona USA, 2014
…calculation of fault level trivial in comparison to the ‘manual’ methods
The Outram equipment (and associated software) makes calculation of fault level trivial in comparison to the ‘manual’ methods.
Rob Weller, Rina Consulting, UK Power Networks Earth Fault Level Project
“These [PM7000s] really are pucker units”
Following successful measurements using 2 of our PM7000 Power Quality Hire units…
“We captured some good stuff, these [PM7000s] really are pucker units.”
Shaun Smith, Firstfield Electrical Ltd, March 2021
Shaun Smith, Firstfield Electrical Ltd, March 2021
Outram PM7000FLM proved capable of reliably assessing Fault Level
The Outram PM7000FLM and associated software proved to be capable of reliably assessing / calculating fault level from both repeated low-level steps, as well as one-off larger pulses.
Rob Weller, Rina Consulting, UK Power Networks Earth Fault Level Project, March 2018
I have been quite astounded at the detail the Outram Data Logger has captured.
During communications regarding the 3 PM7000TIs that Bob is managing remotely, with new data sent back to him over email every 24 hrs, he told us that he has been finding detail in the recordings he never thought he would see. “I have been quite astounded at the detail the Outram Data Logger has captured.”
Bob King, Power Phase Services, UK
Fault Level Monitors to Validate ENWL RESPOND Project Network models
Fault level monitors – Outram fault level monitors have been installed at seven [Electricity North West] Respond [Project] sites. These monitors will validate our network model and the Fault Level Assessment Tool. Electricity North West Ltd RESPOND Project Newsletter, May 2016.
Electricity North West Ltd RESPOND Project Newsletter, May 2016.
I have used data loggers in the past… Not in the same league as the Outram equipment
Thank you for all your fantastic efforts yesterday.
I have used data loggers in the past but they were not in the same league as the Outram equipment.
Last December when Network Rail asked me to install PQ monitoring I looked at hiring a couple of [competitor] PQ monitors. I had a Network Rail Graduate alongside me and I thought it would be a good learning exercise for him. As I began to understand the railway electrification system I realised [these] were a non-starter, so when the local electricity board ‘turned the screw’ I decided to look deeper.
I discovered Outram and when I read about your collaboration with Scottish Power I immediately realised the Outram equipment was the only one to consider. From what I have seen since yesterday morning I know I was correct in contacting your company.
Bob King, Power Phase Services, UK (Contracting for Network Rail)