
Electricity North West Ltd’s RESPOND project
Outram Research Ltd worked with ENWL on their OFGEM funded, £5.5 million RESPOND Project (Tier 2 LCNI).
As part of this project 4 PM7000FLMs were deployed at multiple points on the Electricity North West Ltd network to validate their existing Fault Level models.
The RESPOND project:
https://www.enwl.co.uk/zero-carbon/our-key-innovation-projects/respond/
As we all move to a low carbon future, demand for electricity is set to grow, increasing fault level on the network. Respond ran from January 2015 until October 2018, to maximise the use of Electricity North West Ltd’s existing assets, reduce costs to their customers and speed up the connection of new demand and generation.
As part of the RESPOND project, Electricity North West managed their network using a Fault Level Assessment Tool (modelling software) which estimates Fault Level in near real time. Acting on these estimates, a series of 3 innovative technical and commercial techniques were deployed to reduce the fault level if necessary without the need for expensive and time consuming asset replacement.
To learn more about Fault Current and about the RESPOND Project click here to watch a short video.
The Fault Level Assessment Tool (FLAT, developed during the project) estimates the changing fault level on the Network using existing published fault level values. As part of the project, Outram PM7000FLMs were used, along with new, more detailed computer models calculated using IPSA+, to validate the RESPOND electrical network model and simulated fault levels.
“Outram fault level monitors have been installed at a total of seven Respond sites. These monitors have been installed for the purpose of network model validation of both the Electricity North West IPSA+ network model and the Schneider Fault Level Assessment Tool. The first set of results have been provided from three sites, with validation work ongoing by the project partners.” Quote from the Electricity North West 6 monthly RESPOND Progress report, June 2016.
Representation of Project Partners’ Relationship and Fault Level Validation pathway.
The PM7000FLMs generated the following results:
Outram wrote 4 reports documenting the results obtained from Fault Level monitors installed at 11 RESPOND trial sites. These can be found on the ENWL website link below in the section ‘Fault level monitoring reports’.
What results were generated?
| Prospective Measurement | Explanation |
| 10ms Peak Upstream Fault Level | Peak Make Fault Level. The fault level when a breaker re-closes after a fault, when the fault is still present. |
| 10ms Peak Downstream Fault Level | Fault Level Contribution from motors/ generation downstream from the measurement point. |
| 90ms RMS Upstream Fault Level | RMS Break Fault Level. The Fault Level at the time when a breaker opens to protect the circuit. |
At a couple of dissemination events run by ENWL the first set of results were discussed. Here are those FLM results and the percentage comparisons with IPSA+ model results prepared by TNEI.
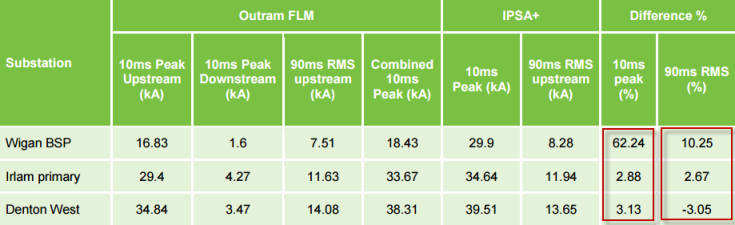
This table shows that there was better agreement at two of the trial sites compared with the third.
The FLM and IPSA+ results at both Irlam Primary and Denton West showed good agreement with each other, around 3% difference. However those at Wigan BSP were significantly different. This led the teams to go back and look at the results. Since there was little room for interpretation on the results from the PM7000FLM (seen at the bottom of this page), TNEI went back to see if there was anything further to report with regards the IPSA+ model.
They suggested that ENWL check the 400/275 kV National Grid topology to make sure that it was in line with what was actually operating on the network during the measurement period. This brings to light the importance of measuring the actual Fault Level as a validation / enhancement to the modelling process.
This is what TNEI wrote on page five of their report written for Electricity North West Ltd: LCNF Fault Level Monitoring and Modelling of ENW Network, 28 April 2017.
“The comparison of the IPSA and FLM results for Wigan location suggests that the 400/275 kV topology of wider National Grid transmission network feeding Wigan Grid in the network model may not be consistent with the actual operating scheme during the period of measurements. We recommend that ENWL check the 400/275 kV National Grid topology in this area and update the IPSA model if necessary in accordance with the latest National Grid week 42 data before making another comparison with the FLM results.”
The full report can be downloaded from the ‘Fault Level Monitoring and Modelling’ section on the ENWL website:
Observations from TNEI regarding the ENWL’s G74 Model on Downstream Fault Level Contribution
Following the measured Fault Level results gathered across 11 sites in total, TNEI also came up with various conclusions and recommendations regards ENWL’s G74 Model (see below). These are similar observations to those made by Jon Berry of Western Power Distribution from their FlexDGrid Project.
Both sets of conclusions, that downstream contribution may be underestimated dependent on the type of load present on the network, have been arrived at following measurement of the network prospective fault levels using Outram PM7000FLMs. This highlights the importance of actual Fault Level Measurement. For further information on the work that WPD has carried out on Prospective Fault Level Monitoring and how we were also part of their £13 million Real Time Fault Level Monitoring Project, FlexDGrid, please click here.
Excerpt from TNEI report on G74 models:
“The results of the four trial locations consistently suggest the peak make fault contribution from ENWL’s G74 models is most likely underestimated and that the ER G74 may need to be revised to reflect the change in load mix of today. This report provides useful information by studying a variation of the G74 model having a double fault contribution compared to the one suggested by the guideline and currently used by ENWL.
It should be noted that ER G74 was developed in 1992 and since then the load mix and appliances used in commercial and industrial environments may have changed.
The industry practice is to employ the same G74 model, irrespective of the mix of load in each location or area. This is understandable as it is difficult for the distribution operators to separate consumers or areas of consumers in different categories, i.e. predominantly households, predominantly industrial.”
Example Data Generated from the RESPOND trial sites
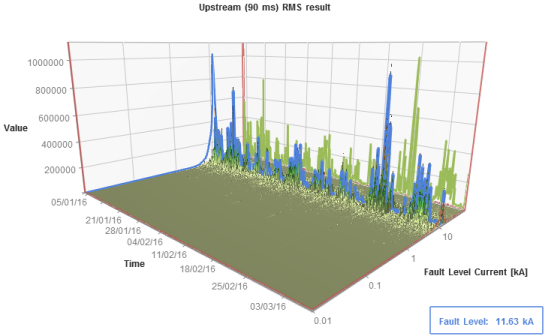
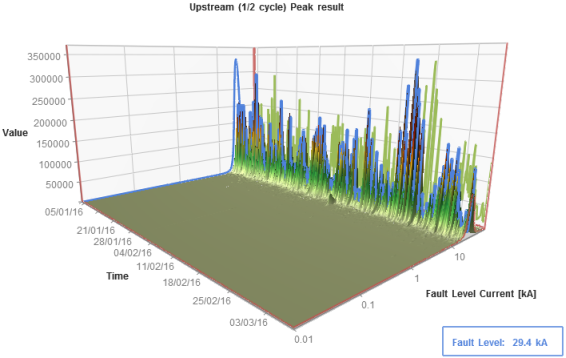
The following graphs show 3D and 2D representation of some of the fault level results captured during the RESPOND project. The 3D graphs, generated in our comprehensive Power Quality Software, Pronto, show Time along the x axis, Fault Level along the z axis and result Value (weighting*) along the y axis. Each 1/2hr period of the recording generates an individual result (an aggregation of all the tiny data points generated over that period from each of the relevant disturbances measured) and all of these individual ½ hourly results are then aggregated in Pronto to produce an overall short circuit current result. In the first example below, at Irlam Primary, the aggregated upstream 90ms RMS result is 11.63kA.
*The size and shape of the disturbances measured determines how much attention is paid to the result generated. A result is likely to be relatively more accurate the bigger and more abrupt the disturbances are so data points from bigger, more abrupt disturbances are therefore given a higher weighting value, when considering the overall result.
Irlam Primary 90ms upstream RMS result (3D)
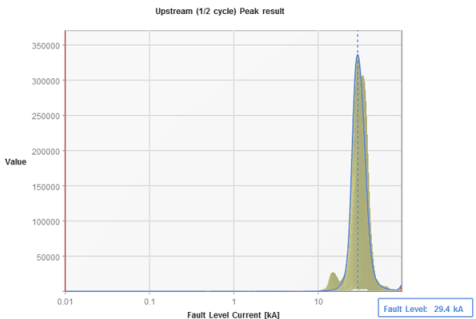
Irlam Primary 10ms (1/2 cycle) peak upstream result (3D)
Irlam Primary 10ms (1/2 cycle) peak upstream result (2D version of the graph above)
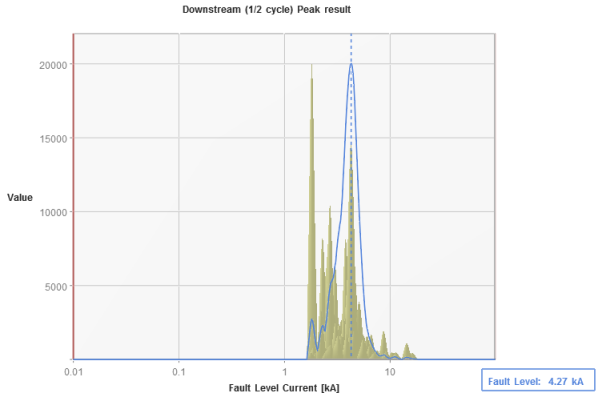
Irlam Primary 10ms Peak Downstream Contribution result (2D)
Wigan 10ms (1/2 cycle) peak upstream result (3D)
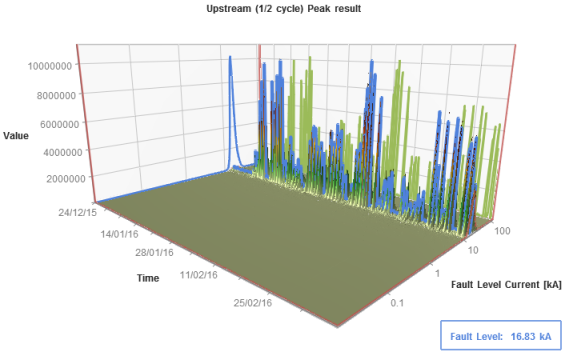
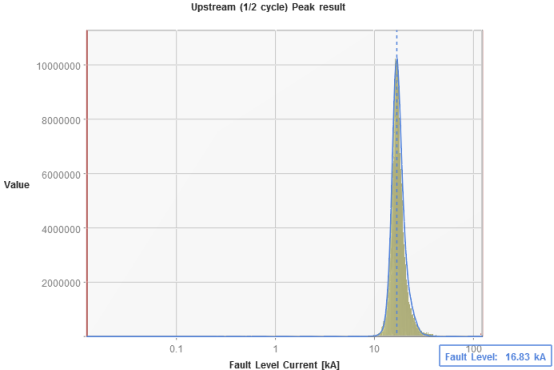
Wigan 10ms (1/2 cycle) peak upstream result (2D version of the graph above)
If you would like to be talked through the Fault Level results seen here or find out how the 3D graphic features work in Pronto for Windows or learn more about how you can make use of our Prospective Fault Level Monitor, the PM7000FLM, please do not hesitate to call us on +44 1243 573050 or for more contact details and a call back form, click here.
Click here for more details on our work with other UK Distribution Network Operators