Article ID: 050413jdo
Last Reviewed: July 10, 2023
The information in the article applies to:
Target Audience
This article is aimed at:
- Advanced users and distributors of the PM1000, PM2000-F and PM3000-HF.
Summary
The following note discusses Flicker in the relevant Outram Research PM series products.
Standards
The Flicker Measurement Function is described in IEC61000-4-15 with Amendment for 230V 50Hz and 120V 60Hz systems. The PM series flicker filters have been implemented to conform to the “Flicker meter” model described in detail in the IEC specification. In addition supplementary test data for detailed conformance testing has been taken from draft working documents in preparation by other organisations [1].
Outputs Available
The IEC Flickermeter specification calls up a number of optional and three mandatory outputs. The optional outputs come from intermediate stages of the somewhat complex filtering process and are useful only during trouble shooting or Flickermeter testing. The mandatory outputs provide useful information when a (presumed working) system is applied to real life voltages. A further “flag” output indicating input signal relevance is also provided.
For the user, Flicker is assessed using the three mandatory parameters and the flag:
1) Instantaneous Flicker Sensation, whose units are defined as PFS, is a very short term measure of how the (model of the) eye-brain responds to flickering incandescent lights, assuming that such a light will flicker if the voltage applied is itself varying. 1 unit of Pfs corresponds to the flicker level at which the average person begins to become aware that Flicker is present. It is the threshold of Perceptibility for half the population. The Flicker level at which humans actually become irritated is somewhat higher so although the Instantaneous Flicker Sensation (Pfs) is used to obtain cumulative irritation levels, a value of just 1 for Pfs is not considered high enough to produce irritation in an observer.
Pfs is an immediate indication of Voltage quality as perceived by humans, and as such is a valuable parameter showing quantitatively whether an installation may or may not suffer flicker problems. It is particularly valuable when related in time to load variations at an installation. Significant Pfs coincident with household appliance switching immediately suggests local line impedance may be too high.
2) PST is Short Term Flicker Perceptibility. It is the measure over a short period (a few minutes) of how irritating Flicker is thought to be. It is based on statistics of Pfs, in an attempt to assess the cumulative effect of Pfs levels reaching into the region causing irritation. Irritation may be caused by consistent minor flicker or occasional major flicker events. The statistical treatment used to obtain Pst is intended to model the way humans react. One perceptibility unit of Pst is considered to be the borderline irritation level for half the population.
3) Finally PLT, Long Term Flicker Perceptibility, is a further measure for cumulative irritation caused by very occasional gross flicker events, which may be too infrequent to cause meaningful Pst (Short Term Perceptibility) results. Plt is derived from Pst and is usually measured over a period of hours. If Pst is constant over the long term period, Plt = Pst.
4) The “Flag” function is used to signal to the user that input conditions which should not be part of the Flicker assessment are present, and have been excluded from the Short and Long Term calculations. The Conditions which are Flagged (and excluded) are variations in excess of 20% from the mean. Dips, Surges and Brown-outs and the like could otherwise have an overwhelming effect on the flicker results, and potentially make the normal low level flicker assessment impossible. They can also cause loss of arithmetic precision. To prevent “chatter” on the Flag result, 2% hysteresis is applied so that the once flagged, a variation must fall back under 18% from the mean to be re-admitted to the assessment process. The normal Flag condition indicating good input signals is “Raised” with a value of 1.00. Bad input conditions cause the flag to fall to 0.00. The Flag assessment is made on the whole cycle RMS result before that cycle’s data is passed to the Flicker Processing system.
As presently implemented the Instantaneous Flicker Result DOES receive all the input data. The Short Term classifier is starved of input data during flagged conditions, however the statistics obtained while unflagged are still processed at the end of each Short Term Interval so Pst and Plt may still change even though the voltage conditions are bad and the flag is down.
Processing applied under conditions of voltage variation.
|
Voltage condition |
Flag |
Pfs processing |
Transfer Pfs to Pst processing |
Pst, Plt calculated on available data |
|
Normal |
Good/Hi (1.00) |
Yes |
Yes |
Yes (all data) |
|
Within +/- 20% of mean |
Good/Hi (1.00) |
Yes |
Yes |
Yes (all data) |
|
> 20% from mean |
Bad/Lo (0.00) |
Yes |
No |
Yes (excludes Flagged data) |
|
> 18% from mean * |
Bad/Lo (0.00) |
Yes |
No |
Yes (excludes Flagged data) |
* Once Flag is Bad, voltage must return within 18% from Mean to reinstate flag.
If, for presentation purposes, the entire Short Term or Long Term interval should be “black-listed” because of any Flag activity during the interval, Pronto’s reporting or Max/Min trace generation facility may be used to create the necessary results/graphs.
Interval Selection and Long Term Flicker result processing
The IEC Standard requires that Short Term intervals may be specified from 1 to 15 minutes, and that Long Term intervals from 1 hour to 1 week be available. Normally 10 minutes and 2 hours are used.
|
Short Term Intervals available in PM products (minutes) |
1 |
|
2 |
|
|
5 |
|
|
10 |
|
|
15 |
Any Long Term interval from 1 to 168 hours (1 week) may be selected. All time interval boundaries are arranged to coincide with convenient clock times. For instance short term results for an interval specified of 10 minutes become available “on the hour” and at 10 minutes, 20, 30 ,40 and 50 minutes past the hour.
As previously discussed, Long Term results are based on Short term results. It is understood that the intention behind the specification was for the Long Term Flicker result to be updated whenever a new Short Term result becomes available, by processing with a “rolling box-car” such that for Short and Long term intervals of 10 minutes and 2 hours respectively, a new Long term result would become available every 10 minutes based on the previous two hours, i e the previous 12 Short Term results only.
The PM products apply box-car equal-weight processing for all combinations of Short and Long Term intervals up to a ratio of 144 as shown in the table below. This readily accommodates the standard 10 mins/2 hours, as well as 1 min / 2 hours, or 10 mins / 24 hours. The PM products can also accommodate combinations even more extreme than this, however the box-car processing is not available, and only one Long Term result is available per Long Term interval.
Box-car processing and interval combinations
|
Short Term selection (mins) |
Long Term selection (hours) |
Ratio LT/ST |
Box-car processing |
Result updated every (mins) |
|
1 |
1 |
60 |
yes |
1 |
|
2 |
1 |
30 |
yes |
2 |
|
5 |
1 |
12 |
yes |
5 |
|
10 |
1 |
6 |
yes |
10 |
|
15 |
1 |
4 |
yes |
15 |
|
1 |
2 |
120 |
yes |
1 |
|
2 |
2 |
60 |
yes |
2 |
|
5 |
2 |
24 |
yes |
5 |
|
10 |
2 |
12 |
yes |
10 |
|
15 |
2 |
8 |
yes |
15 |
|
2 |
4 |
120 |
yes |
2 |
|
5 |
12 |
144 |
yes |
5 |
|
10 |
24 |
144 |
yes |
10 |
For Long Term intervals > 1 day, only one result per Long interval is usually available.
|
Short Term selection (mins) |
Long Term selection (hours) |
Ratio LT/ST |
Box-car processing |
Result updated every (hours) |
|
10 |
48 |
288 |
no |
48 |
|
10 |
72 |
432 |
no |
72 |
|
10 |
168 |
1008 |
no |
168 |
Timing relationships and Presentation of Results
The following graph shows a short section of typical results from measurements using the “Standard Line only plus Flicker” PM1000 Configuration on a residential installation. At the foot of the graph the line voltage can be seen varying from 243V down to 227. The next trace up is Instantaneous Flicker Sensation. This is normally very small, < 0.01 perceived units, but any step change in the RMS voltage clearly generates an immediate flicker sensation signal, with the voltage drop at 2:12 causing a high value of 30 p.u. There are no significant dips during the recording so the flag (middle channel) remains high (good) throughout.
The graph shows the actual recorded relationship between the Short Term Flicker result (Pst) and the Instantaneous Flicker Sensation (Pfs) on which it is based.
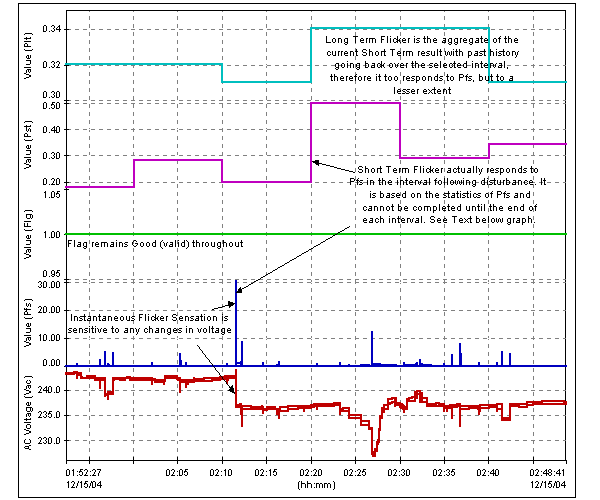
Clearly the statistics on the period from 2:10 to 2:20 are not complete until 2:20. For visual convenience, Pronto is able to bring forward both Long and Short term results by one Short Term interval, so that the Short Term result (and also the Long Term) show the effect of a spike on Pfs in the same interval in which it occurred. The following graph shows the revised presentation:
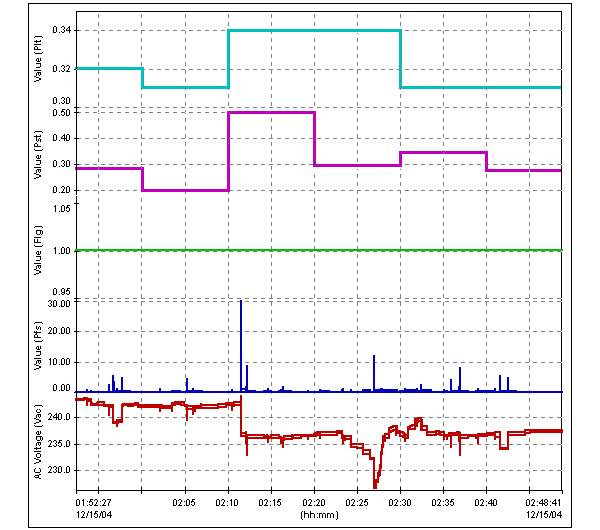
In this graph the voltage step (at ~2:12), the resulting Pfs, and the consequent effects on Pst and Plt are all shown in the same 10 minute interval, even though clearly the step change in Pst from 0.2 to 0.5 shown at 2:10 cannot have occurred before the event causing it!
Input voltage Range.
The system is designed to provide high quality Flicker Measurements over the input range 100V to 270V. The “Voltage Adaptor” feature required by the Standard allows for long term variations of input voltage so that Flicker intensity is (relatively) independent of absolute RMS voltage.
Performance.
There has been much controversy over the way different manufacturers’ Flickermeters respond differently to the same input, and various proposals are under consideration in both Cigre and IEEE to try to define tests, conformance to which should promote more consistent measurement results across different models when all are exposed to the same particular flicker scenario.
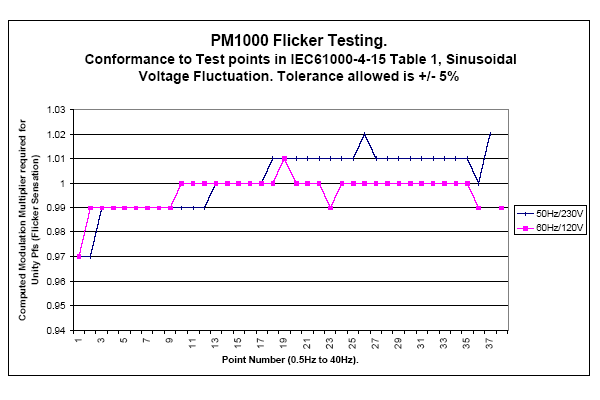
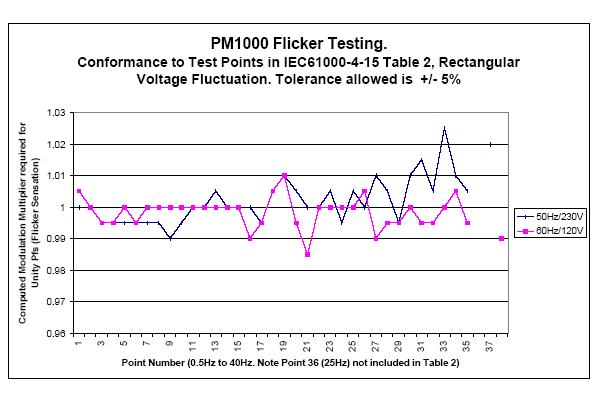
In the PM products all three parameters are derived using the IEC61000-4-15 model for human behaviour. The measurement process meets all the Flicker Tests specified in the standard (Tables 1, 2 and 5) and in addition meets the new test points at 33.333/40Hz for 50/60Hz systems currently being proposed by both Cigre and IEEE as well as all the numerous intermediate points currently being considered by the IEEE. Dynamic Range is in excess of the levels required for the highest class of instrument meeting the proposed Cigre tests from a Pst of <0.2 to >20.0. The internal classification system is based on 1024 bins (IEC specifies a minimum of 64), and Pfs is sampled for the classifier at >= 200 Hz (IEC specifies 50Hz minimum).
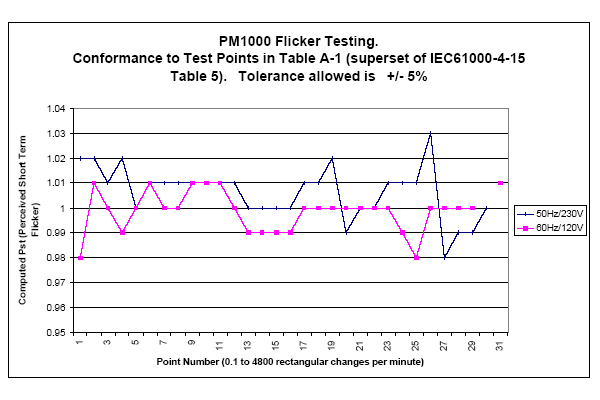
Graphs 1 and 2 show complete conformance to Tables 1 and 2 from the IEC Standard. Graph 3 shows conformance to the 8 points specified in Table 5 from the IEC Standard, and in addition shows conformance to all further 23 points understood to be specified in forthcoming IEEE Standard.
Linearity has been tested using the CIGRE proposed test. [ The section Linearity Results (at the end of this appendix) shows that PM flicker filter performance easily meets the requirements for the highest class of instrument. ]
Displayed/Recorded range of Pfs (Instantaneous Flicker Sensation)
Note that Pfs is a volatile parameter corresponding to the square of voltage fluctuations. In order to display a useful result in the borderline irritation region, this is expressed (like Pst and Plt) to 2 places of decimals. Consequently Pfs may collapse to zero even though Pst is non-zero, or exceed the 299.99 upper display limit for severe events even while Pst is modest. Pfs is maintained internally to very much greater precision than is displayed.
Demonstration modes
The PM products have flicker demonstration modes. The following section describes these using the PM1000 as an example.
The PM1000 has a flicker demonstration mode for distributors to make demonstrations to customers, or for knowledgeable customers to conduct their own tests. Presently there are two regimes: static or swept. In both cases the user specifies the modulation level to be applied.
The demonstration mode is entered using the serial port from a PC running a terminal communications program like “Termview”, “Hyperterminal” or “Windows Terminal”. [If you do not have such a program contact Outram Research who will be pleased to send you “Termview” which was written for communications to the Outram Research products and is ideal for this purpose.]
The commands to enter the Flicker Demonstration mode are (at the prompt):
PM1000> Flicker <Changes per minute> <Modulation level (%)>
The parameter “Changes per minute” is used to control the regime.
- Specifying Changes per minute POSITIVE requests a static rectangular modulation test at the change rate figure specified. This may be set from 0.1 to 4900 Changes per minute, enabling the entire span of tests in the spec to be applied.
- Specifying Changes per minute NEGATIVE specifies a fast sweep. The frequency range of 1 to > 4000/4800 (50/60Hz) changes per minute is swept logarithmically in about 23 minutes. When it reaches the highest rate it starts again. IF this mode is selected on a PC running a simulation of the PM1000, then the modulation is applied SINUSOIDALLY for examination of conformance with Table 1 of the IEC61000-4-15 specification. Examine or Record the Instantaneous Flicker Sensation.
- Specifying Changes per minute as ZERO specifies a slow sweep from very low frequency in which the modulation is always rectangular. The frequency begins at 1 change every 10 minutes and sweeps logarithmically up to > 4000/4800 (50/60Hz) changes per minute. The sweep time is nearly four hours, so that conformance both Table 2 Pst and Pfs can be assessed for the very slow changes.
Modulation level is specified in percent to up to 4 decimal places.
The mains frequency present when the test is invoked specifies the frequency to be applied during the test and the selection of Flicker processing parameters. (which are different for 50 and 60 Hz applications)
Examples:
With the PM1000 attached normally to 50Hz mains, type
PM1000> Flicker 1620 0.402
this will apply 0.402% pk-pk rectangular modulation at 1620 changes per minute, i e testing point 6 from spec Table 5 for a 50Hz system.
PM1000> Flicker -1 1.00
this will apply 1% pk-pk rectangular modulation swept from 1 to 4000 changes per minute.
Simulator running on a PC
If the SIMULATION is running on a PC, the same things can be done, except that the test
PM1000> Flicker -1 1.00
will apply 1% pk-pk sinusoidal modulation swept from 1 to 4000 changes per minute.
It is particularly useful to record results for subsequent analysis – this can be done on the Simulator by making a recording in the usual way (through PMScreens), then using the PM1000 text window command “mirrorrd” (which stands for “Mirror the Ram Drive”) to assemble and copy the recorded data into a directory called c:\aaa\PM1000Sim\mirrorrd on the PC. Note that this directory path MUST exist beforehand. These are engineering conveniences and not “whole world user friendly solve all problems allow for ignorant users” commercial programs! The resulting .MDM file can then be drag-and-dropped into Pronto as a normal .MDM file.
[1] Both IEEE (WG 1453) and CIGRE are working on extending the tests required to demonstrate conformance to the IEC Flickermeter model. Information available on some of these tests have been used to increase the scope of tests applied to the PM Series Flickermeter filter. It is understood that a computerised model of the IEC Flickermeter is considered to be the “Gold Standard” by which manufacturer’s hardware Flickermeters may be judged, and the extended tests proposed above will be applied to both the Computer Model and manufacturer’s hardware for results comparison. The PM Series Flickermeter discussed in this note is implemented very closely in conformance with the IEC model and with the computerised version, as evidenced by the quality of the results shown. Consequently it is expected that extended tests will yield similar levels of conformance.
Graph 1. Table 1 conformance
Notes:
The IEC61000-4-15 Table 1 lists 37 frequencies at which the Flickermeter should confirm to the specification. The Flickermeter is said to conform if the nominal modulation level specified in the table has to be adjusted by no more than 5% to achieve the required output. The less adjustment that is required, the better the conformance.
For example, the first point in the table tests 0.5Hz. A nominal sinusoidal modulation level of 2.340% (50Hz) or 2.457%(60Hz) should give an output of 1 precisely. For consistency of test results, the authors/designers of the tests specified that rather than permit the output to vary by a limited amount, they would allow the input to be varied to achieve the output figure of 1. From Graph 1 above, it can be seen that in order to achieve the output of 1, it is necessary to reduce the input modulation level by a factor of 0.97 for both the 50 and 60 Hz cases. An adjustment factor of 0.97 is less than 5% therefore that point conforms. As can be seen that very low frequency point is actually the worst.
At the top of the frequency band the final frequency points are 25Hz, then 33.33Hz for 50Hz systems and 40Hz for 60Hz systems. On the above graph these are points 36, 37 and 38 respectively. Consequently there is no result for point 37 at 60Hz, nor for point 38 at 50Hz. The same applies to Graph 2 below, and in addition, the 25 Hz point 36 is not specified in IEC61000-4-15 Table 2 consequently that is also missing from Graph 2.
Graph 2. Table 2 conformance
Graph 3. Table 5 conformance
Linearity Results
| PM Flicker Linearity Tests at Cigre Test Frequencies | 6th Dec 04 | ||||||
| Note: | To make the tests possible precision computed values at the correct resolution are | ||||||
| substituted for the actual Input A/D results. A/D Linearity and inherent noise floor | |||||||
| are apparent when normal A/D output is used – during quiet periods Pfs is << 0.01, | |||||||
| Pst floor is <= 0.07p.u. For pure sinusoidal 230V input, total harmonic content on | |||||||
| A/D output is unmeasurable (< 0.05V). | |||||||
| Mains Frequency used for tests: 50Hz | |||||||
| Changes per minute |
1620 |
||||||
| Nominal Modulation for Unity Pst (%) |
0.402 |
||||||
| PM1000 |
Tolerance |
||||||
|
Modulation level multiplier |
Pst Observed |
Lo |
Hi |
In Tolerance | Normalised Results | ||
|
0.05 |
0.04 |
0.04 |
0.06 |
Yes |
|||
|
0.1 |
0.10 |
0.09 |
0.11 |
Yes |
|||
|
0.2 |
0.19 |
0.19 |
0.21 |
Yes |
|||
|
0.5 |
0.49 |
0.47 |
0.53 |
Yes |
|||
| Region Required to |
1 |
0.99 |
0.95 |
1.05 |
Yes |
0.990 |
|
| meet highest |
2 |
1.97 |
1.90 |
2.10 |
Yes |
0.985 |
|
| (Class 3) performance |
5 |
4.90 |
4.75 |
5.25 |
Yes |
0.980 |
|
|
10 |
9.80 |
9.50 |
10.50 |
Yes |
0.980 |
||
|
20 |
19.59 |
19.00 |
21.00 |
Yes |
0.980 |
||
|
30 |
29.47 |
28.50 |
31.50 |
Yes |
|||
|
40 |
39.17 |
38.00 |
42.00 |
Yes |
|||
| changes per minute |
1 |
||||||
| Nominal Modulation for Unity Pst (%) |
2.724 |
||||||
| PM1000 |
Tolerance |
||||||
|
Modulation level multiplier |
Pst Observed |
Lo |
Hi |
In Tolerance | Normalised Result | ||
|
0.05 |
0.05 |
0.04 |
0.06 |
Yes |
|||
|
0.1 |
0.10 |
0.09 |
0.11 |
Yes |
|||
| Region Required to |
0.2 |
0.20 |
0.19 |
0.21 |
Yes |
1 |
|
| meet highest |
0.5 |
0.50 |
0.47 |
0.53 |
Yes |
1 |
|
| (Class 3) performance |
1 |
1.00 |
0.95 |
1.05 |
Yes |
1 |
|
|
2 |
2.00 |
1.90 |
2.10 |
Yes |
1 |
||
|
4 |
4.03 |
3.80 |
4.20 |
Yes |
1.0075 |
||
|
5 |
5.13 |
4.75 |
5.25 |
Yes |
|||
|
6 |
6.27 |
5.70 |
6.30 |
Yes |
|||