Article ID: 140820kae
Last Reviewed: July 10, 2023
The information in this article applies to:
- All Ranger Power Master Analyser Users
Target Audience
This article is aimed at:
- Those using the Classic version of Pronto for Windows software (images are taken using Pronto 5.73).
Summary
This application note details the sequence advised to use the ‘Examine’ function in Pronto for Windows.
Before you start
- Make sure you are using the Classic version of Pronto. Those using version 6.X can use the context sensitive Help given in that version of Pronto or read the Pronto Quick Reference Guide if available.
- Create a graph of the data streams you would like to examine.
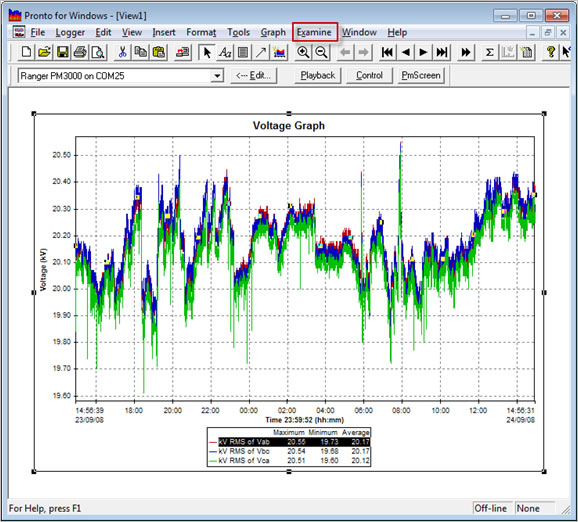
To use the Examine function in classic Pronto for Windows
Click on the trace you would like to ‘Examine’. Then select the ‘Examine’ menu at the top of your screen.
You will be given the following options:
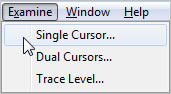
Single Cursor
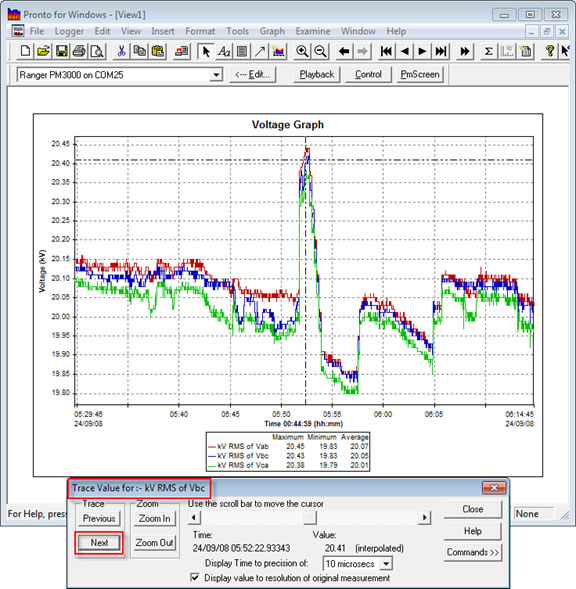
To start with select ‘Single Cursor’. You will now see a couple of dotted lines crossed on the graph.
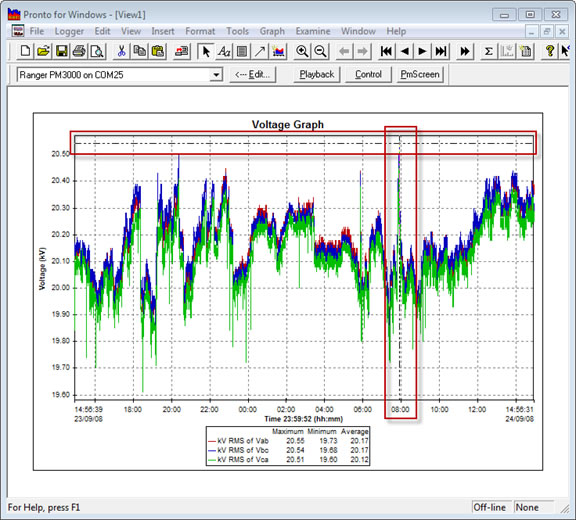
And the following assistant will have opened.
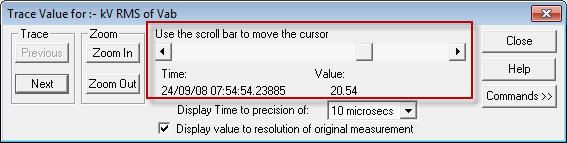
Use the Scroll bar to move the cursor (where the two dotted lines meet) along the trace (data stream) you have previously chosen. You can either watch the time and the value below the scroll bar as you scroll the cursor along the trace or you can take a note of the value when you have reached a particular point on the graph that you are interested in. If you would like to zoom in and out of the graph while you are in this Examine mode, click on the ‘Zoom In’ or ‘Zoom Out’ buttons on the assistant.
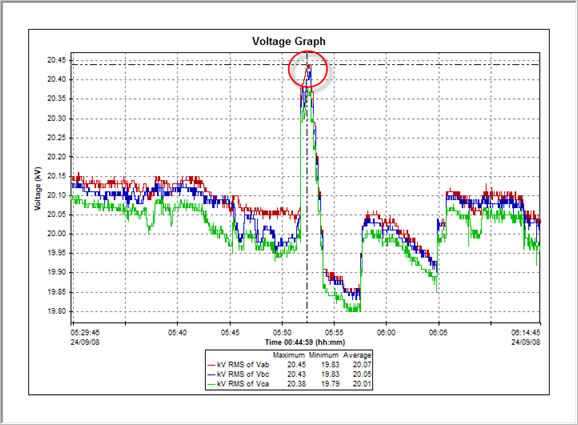
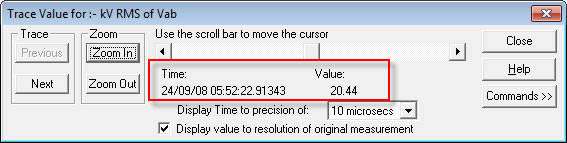
Likewise if you would like to move to a different trace on the graph, i.e. RMS of Vbc, then click on ‘Next’ Trace.
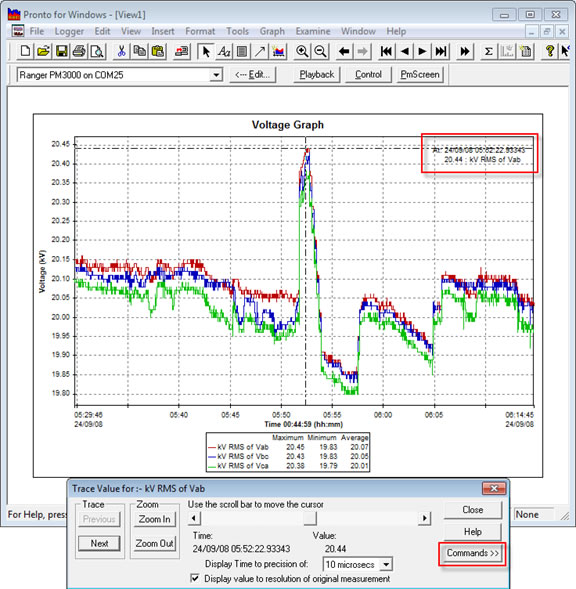
Commands
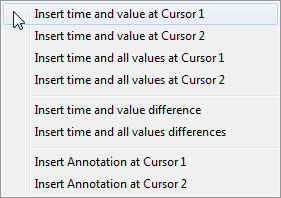
To insert the time and value that you have ‘found’ into the graph as a label or to add an annotation to the graph, click on ‘Commands>>’.
You will be offered the following options:
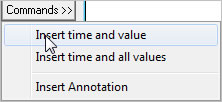
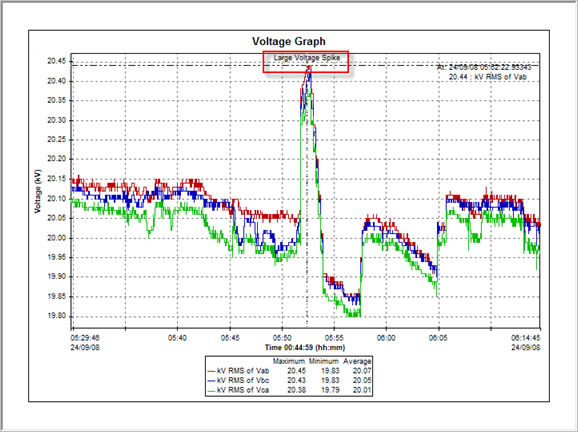
If you ‘Insert time and value’, a label like the one in the graph above will be inserted, but if you select ‘Insert Annotation’, the annotation assistant opens up for you to write your own text.
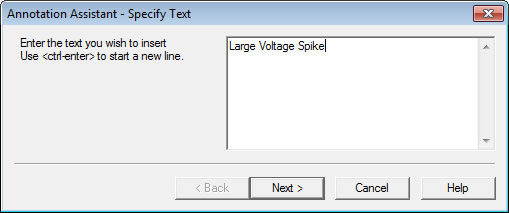
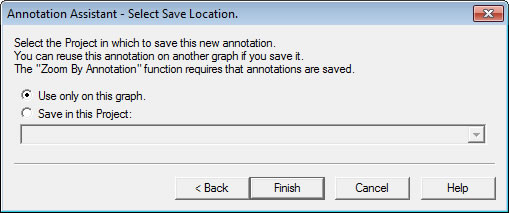
Click on ‘Next’ once you have written your own text and choose whether to save the annotation in the project or just use it on this graph. If you save the annotation to the project you can refer back to it specifically at a later time. Click on ‘Finish’ to exit the assistant and see the annotation on your graph.
When you have finished click on ‘Close’.
You can carry out basic formatting on the annotation by double clicking on it once you have closed the ‘Examine’ dialogue box.
Dual Cursors
To use two cursors on the same trace, go back to the ‘Examine’ menu and choose ‘Dual Cursors’. This then offers you the chance to compare two cursors, e.g. to distinguish the exact length of a voltage spike or the exact size of the spike.
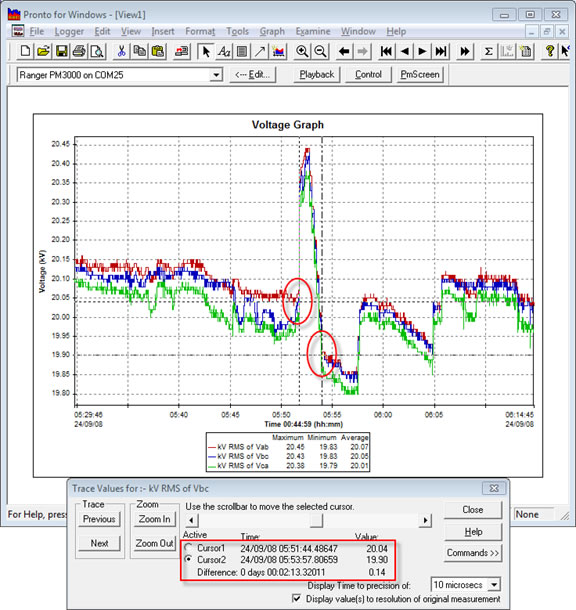
To switch between the two cursors to move them, click in the circles to the left of ‘Cursor1’ and ‘Cursor2’. Once in place you can read the times and values and the difference between the two. The time duration of this spike (i.e. between the two cursors) was 2 minutes, 13 seconds etc. and the difference between the heights on the two cursors is 0.14kV.
Again it is possible to move the cursors on to a difference trace and to zoom in and out of the graph whilst using this assistant. You can also add annotations and insert time and values as you did before with the single cursor, only now you are given more fairly self-explanatory options:
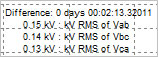
If you choose ‘Insert time and all values differences’ this is the kind of information you might get in this situation.
Trace Level
You can also select ‘Trace Level’ in the ‘Examine’ drop down menu. This gives you the option of setting a threshold value on the graph to measure against.
The following Trace assistant opens with a scroll bar down the left hand side. This is used to set the cursor along the length of the graph.
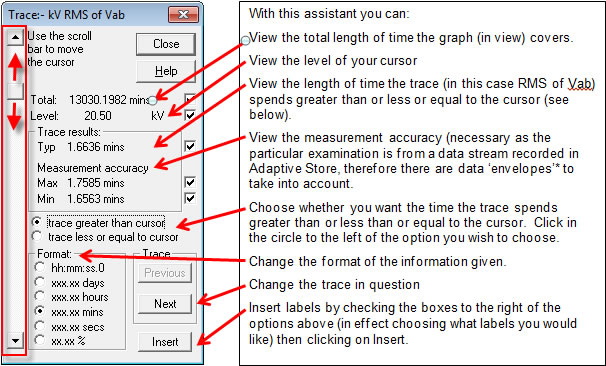
*Data Envelopes are those areas where you are given a max and min envelope for the particular reading. The difference between the max and the min readings on the ‘measurement accuracy’ take into account those cumulative max and min values where the trace crosses the cursor level you have chosen to use in this examination.
Below I have set a cursor value of 20.5kW, selected ‘trace greater than cursor’ and labelled the results of each trace on the graph.
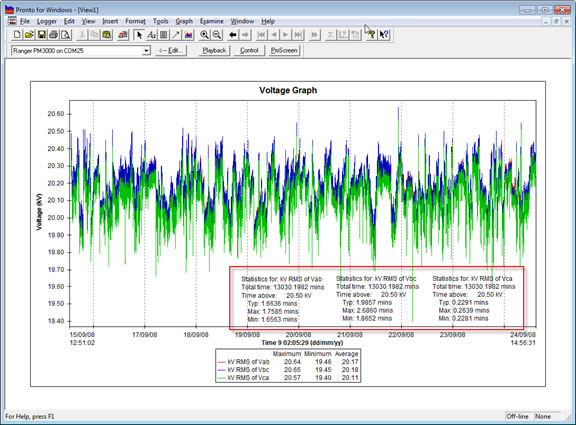
This graph can then be copied and pasted into a Word Document report.
See also:
APPNOTE: How to use the ‘’Exception Filter’ Function in Pronto